Tips for Finch, Telemetry, and Phoenix Live Dashboard
While working on Tune, I needed to collect performance metrics related to the interaction with the Spotify API.
The Finch HTTP client exposes Telemetry metrics, which made it very easy to display them via Phoenix Live Dashboard.
Starting from the stock TuneWeb.Telemetry file generated by Phoenix (see the official guides for an explanation), I just added two new summary metrics to the metrics/0 function:
  summary("vm.total_run_queue_lengths.io"),

  # HTTP
  summary("finch.request.stop.duration", unit: {:native, :millisecond}, tags: [:path]),
  summary("finch.response.stop.duration", unit: {:native, :millisecond}, tags: [:path])
]
With this change in place (commit), I had all metrics being visualized in the dashboard, grouped by the Spotify API path. I wanted to make some improvements:
- The
:pathtag includes query string parameters, so calls likesearch?q=marillionandsearch?q=fishwould be aggregated in different groups. Instead, I would want them to be part of the same group, ignoring query string parameters. - Since I setup Sentry to use Finch as a client, I wanted to exclude calls made to Sentry and only have charts reporting metrics about the interaction with Spotify
Aggregating by normalized path
To aggregate metrics by normalized path, we can apply a transformation function to the metric tag values, generate a normalized path tag and use that to aggregate metrics. As shown in the telemetry_metrics docs, the option we need is tag_values:
def metrics do
  [
    # omitted
    summary("finch.request.stop.duration",
        unit: {:native, :millisecond},
        tags: [:normalized_path],
        tag_values: &add_normalized_path/1
    )
  ]
end

defp add_normalized_path(metadata) do
  Map.put(metadata, :normalized_path, URI.parse(metadata.path).path)
end
We can use the built-in URI module to parse normalized path out of the Finch metric metadata and add it to the metadata itself. With that in place, we can update the tags option to reference :normalized_path. With this change, metrics are aggregated on the endpoint only, without any query string. For reference, here's the relevant commit.
Filtering only Spotify calls
To filter for Spotify calls only, we can use the keep option, which specifies a predicate function that can be used to define which metrics should be kept and which ones should be discarded. Discarded metrics will not appear in the dashboard chart.
def metrics do
  [
    # omitted
    summary("finch.response.stop.duration",
      unit: {:native, :millisecond},
      tags: [:normalized_path],
      tag_values: &add_normalized_path/1,
      keep: &keep_spotify/1,
      reporter_options: [
        nav: "HTTP - Spotify"
      ]
    )
  ]
end

defp keep_spotify(meta) do
  meta.host =~ "spotify"
end
As the meta information already includes a host, we can compare it with the spotify string. The =~ operator makes the comparison a bit more resilient, so that we don't have to worry about the exact hostname, rather a hostname related to Spotify. This choice might need to be revised if we ever end up interacting via HTTP with another service with "spotify" in their host name (unlikely, but possible).
For some additional clarity, we can also use the nav reporter option (see Phoenix LiveDashboard documentation for more details) to make sure that the navigation header displays a name that details the additional filter applied to the HTTP metrics. For reference, see the relevant commit.
Conclusion
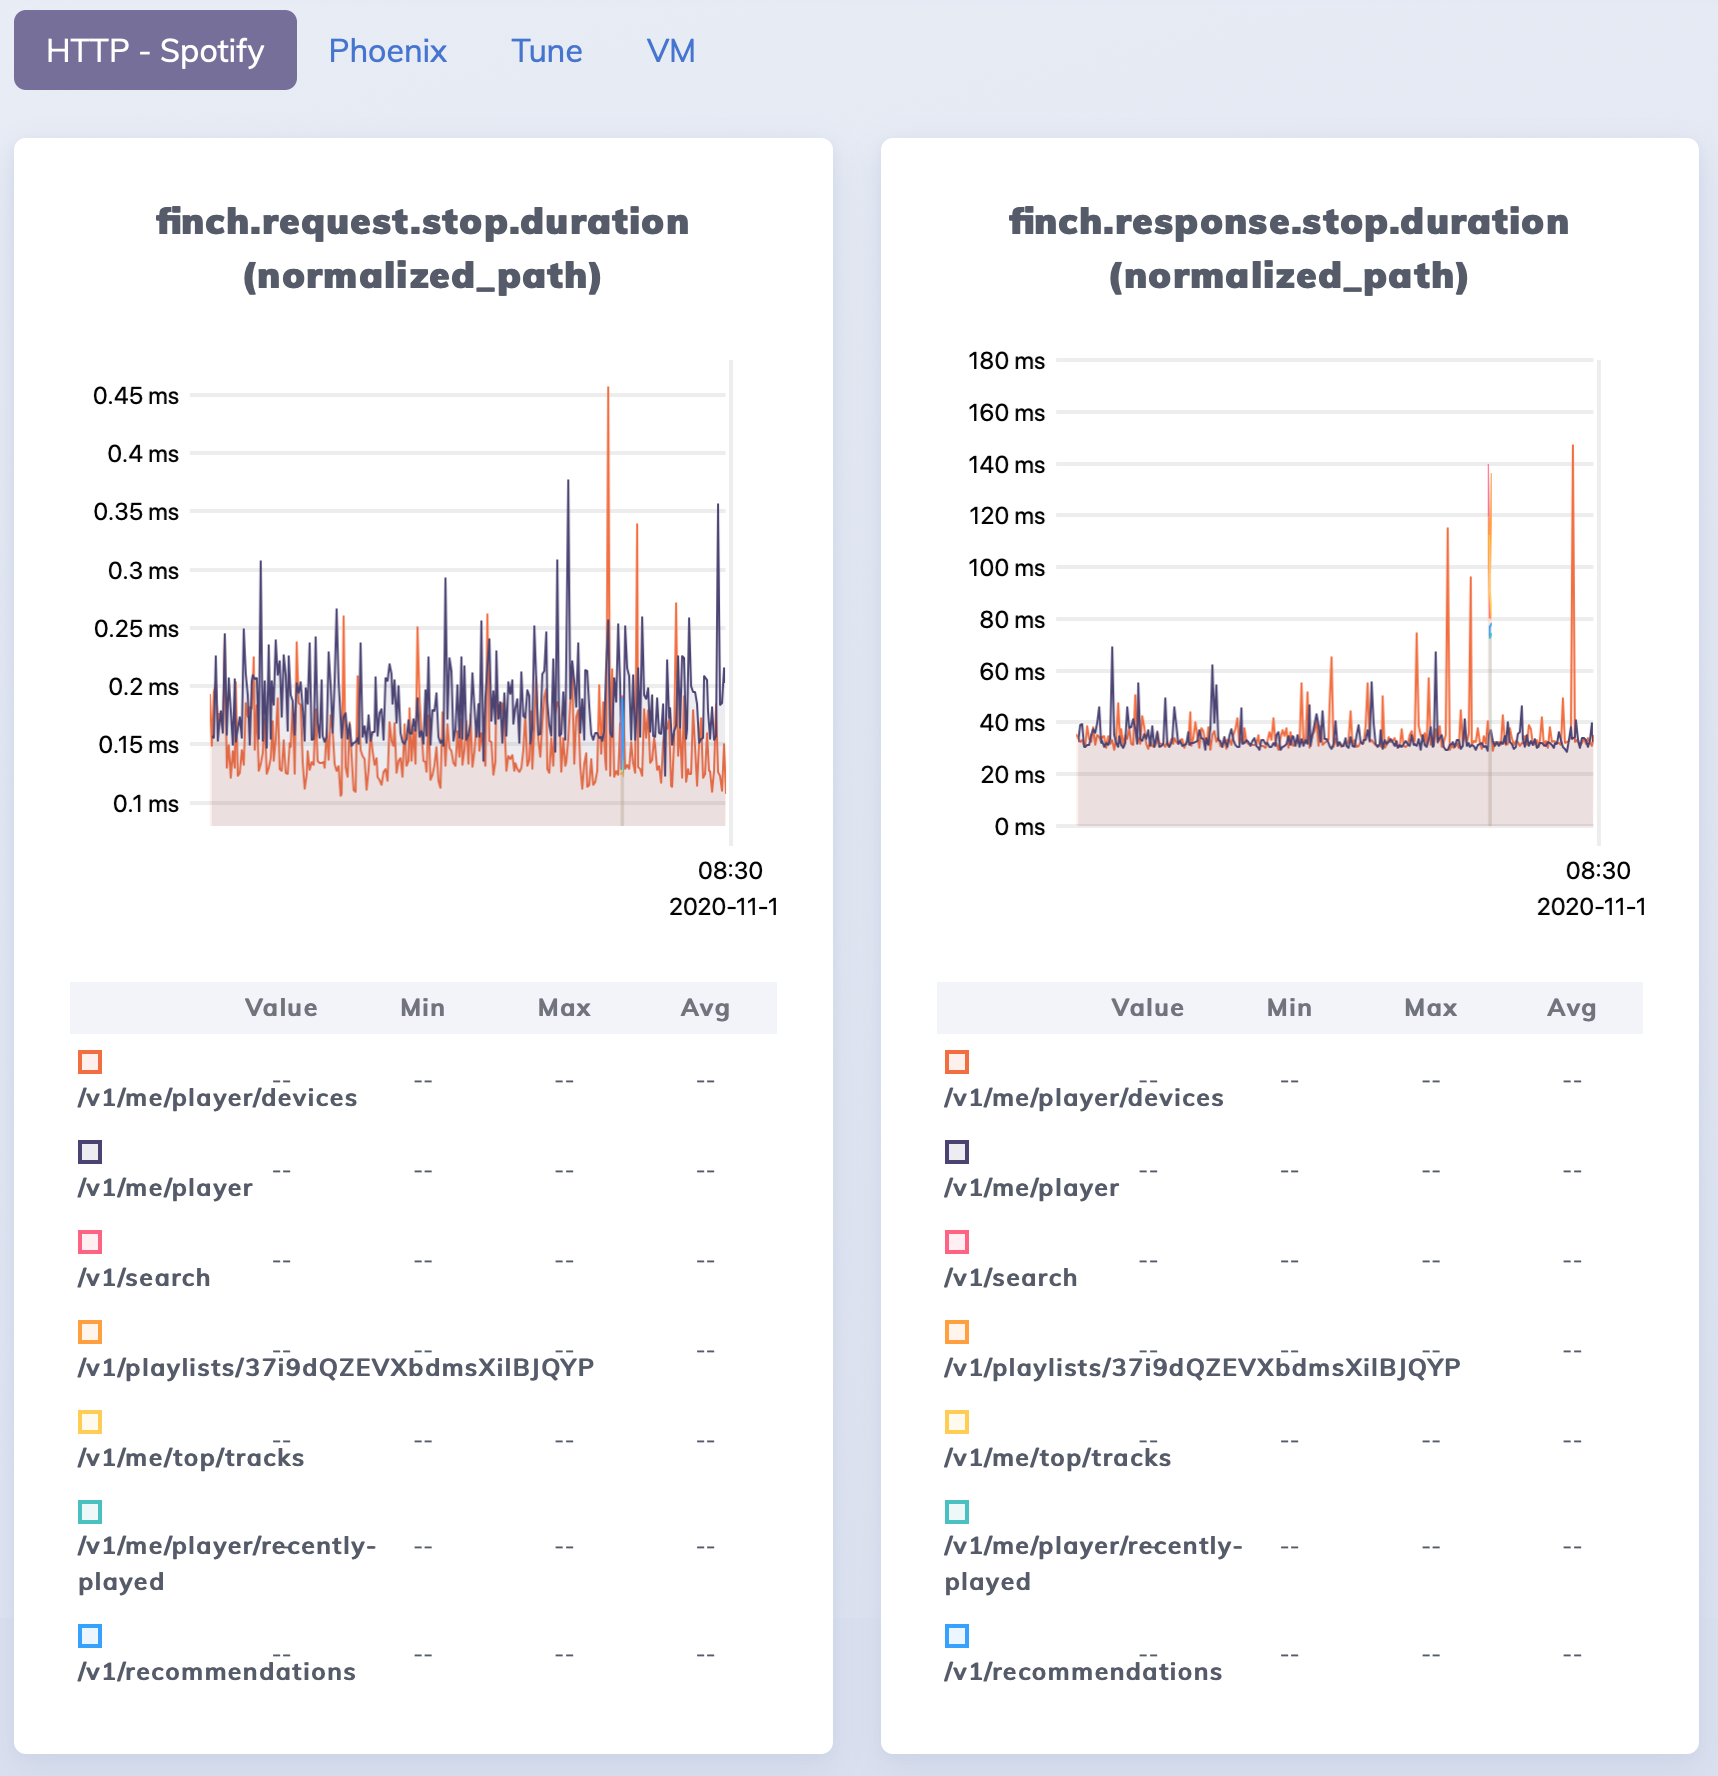
Both improvements required very small updates. Here's the final result, showing the custom Nav title ("HTTP - Spotify") to hint at the filter used to only show Spotify calls, and aggregation by normalized path (without query string).

All in all, I was pleased to see that it was straightforward to customise the charts I needed. One thing I haven't worked on yet is aggregating metrics by logical path, i.e. by route (GET /artist/:id) instead of individual paths (GET /artist/123), but I have some ideas and will come back on it in a future post.